In battery-powered devices, it is particularly useful to be able to view information on their consumption, charge, use, etc. This information, available for several years on iPhones and iPads, on Macs comes recently from the hand of macOS 11 Big Sur. Let’s see how to consult this information and what conclusions we can draw from it.
The battery usage history goes beyond the amount of charge available to the battery over a period of time because cross-reference the information with the use of the machine. It is located in System Preferences, we will access like this:
- In the Apple menu () we choose System Preferences.
- We played on Drums.
- We select Usage history in the sidebar.
Last 24 hours and background tasks

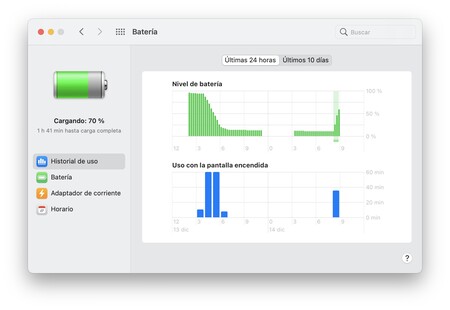
At this point we can choose between viewing the last 24 hours of use or the last 10 days, we will start with the first option. The information is divided into two graphs, at the top the battery level and at the bottom the screen time for a period of time.
It is important to look at the intervals, in the graph of the battery level, each line represents 15 minutes, that is, we have 4 measurements per hour. We can thus see how much the battery changes, increasing or decreasing every quarter of an hour, and have an idea of the speed of charge or discharge. The times when the computer was connected are shaded in light green and indicated by a lightning bolt below the graph. In the graph at the bottom, each bar represents one hour. It represents the length of time, with a maximum of 60 minutes, that the screen has been used during that hour.
Crossing the two graphs, therefore, the usual thing will be that in the hours when the usage time is high, the battery decrease is pronounced. Otherwise, we have to consider that a background app or service is draining the battery more than it should.
Last 10 days and charge cycles

If we change the Last 24 hours to the Last 10 days the information we see is very similar. At the top we see a representation of the battery consumption during the day. If, for example, we unplug the Mac in the morning at 100% and it remains at 0% at night, we will see 100% in the graph. In the case of the graph that illustrates the article, we see that some values are closer to 130%, which means that the Mac was charged during the day and that additional power was consumed as well.
As for the lower graph, it shows us the number of hours the computer screen has been on during a specific day. Here the limit is set at 24 hours, although the usual thing is that it is approaching 8 or 10. Again, there must be a correlation between the screen on and battery consumption to rule out that an app downloads our Mac without our knowledge.
Finally, the top graph gives us an idea of how many charge cycles the Mac has in a week. Useful information to control the wear of our battery.
Whether we are taking advantage of the 20 hours of battery life of the new MacBook Pro with Apple silicone, or if we need to verify that our MacBook Air’s consumption matches our use of it, the Battery Information section of the System Preferences is our ally.


